| FAQ | iOS | Mac |
The Basics
EditingImporting and Downloading dataTroubleshooting |
DivesSelecting All Dives from the Sidebar lets you view all of your dives. 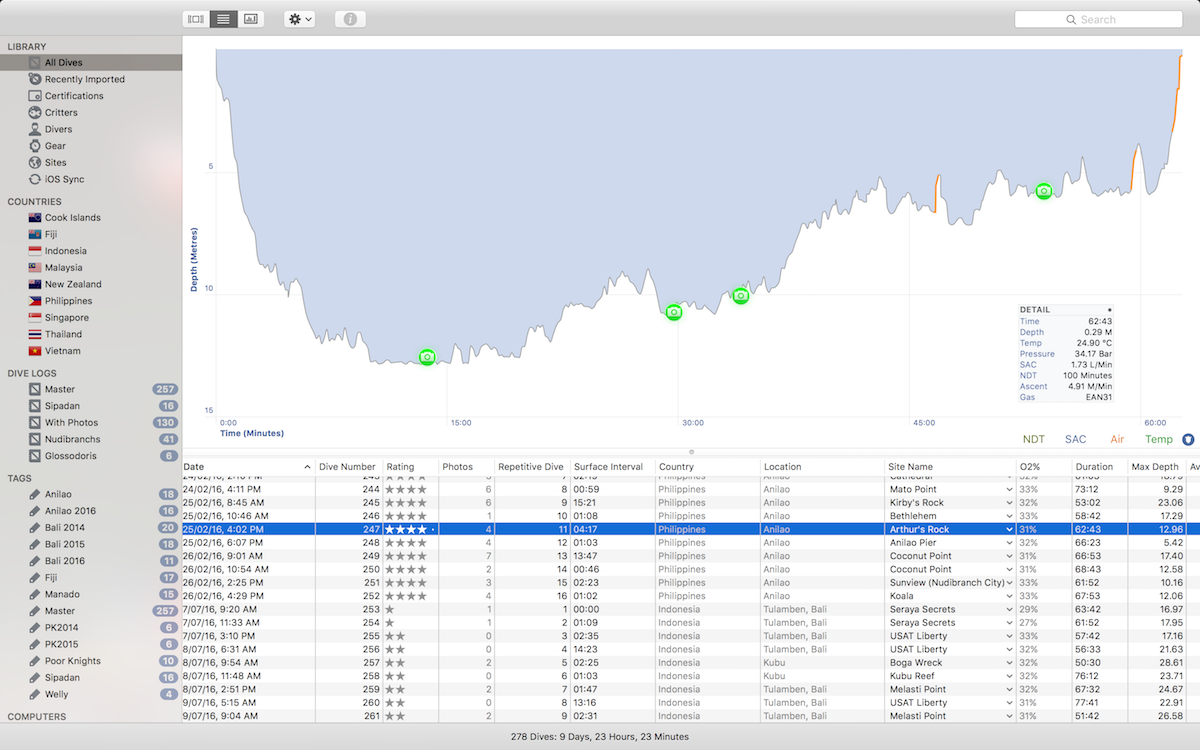
The Dives TableThe main table underneath the profile shows you a list of your dives. By default it contains a small number of columns, however there are many to choose from. You can either visit Preferences > Columns or you can right-click on the header of the table (the part with the column names!) and enable or disable any columns you like. You can click on any of the table column names to sort by that column. Clicking again on the same column reverses the sort order, for example to toggle between earliest date first or last. You can also rearrange the columns by clicking and dragging on the column header/name. Some data can be edited directly in the table. However, some things show as "greyed out". These things can't be directly edited. For example, the Country and the Location. These will change if you choose a dive site, either from the Dive Inspector or from the Site Name column of the table. Profile GraphProbably the thing you'll see the most! The main profile graph displays the selected dive. You may see alarm or image icons appear over it. You can click on these for more information. Profile Overlays
There are extra overlays that can be added to the main profile graph to display information such as PPO2, Temperature, Air Pressure, etc. Depending on the data that is available MacDive will show a set of options in the bottom right of the profile. Clicking on these will toggle the overlays that are displayed. The final option toggles whether alarms are displayed, which can also be toggled via View > Display Profile Alarms or ⌘ ⇧ A. Analysing The ProfileYou can enable or disable the Profile Inspector by choosing View > Display Profile Popup (or using the shortcut ⌘ ⇧ I). When active, moving your mouse over the profile will show you detailed information for that point, depending on what is available. This includes the time, depth, ascent rate, air, gas, and more. You can drag the Profile Inspector around to suit. 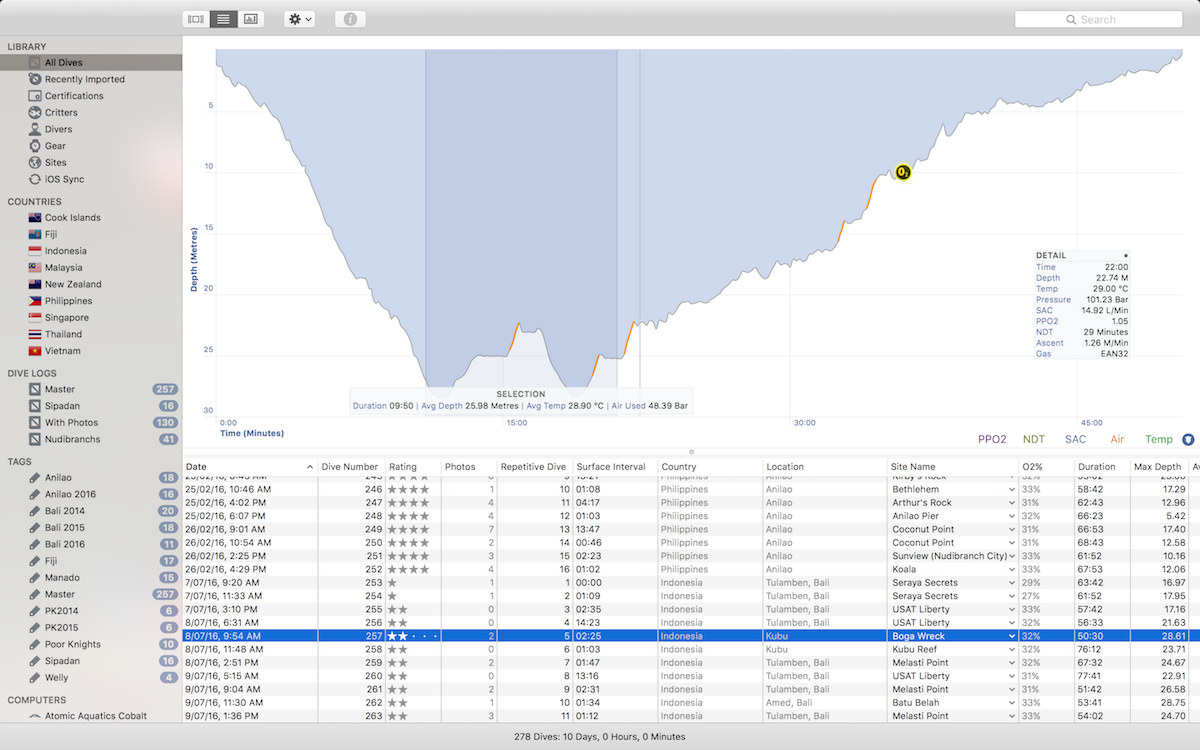
Clicking and dragging on the profile graph creates a selection. You can see information specific to that selection - the average depth, air used, etc. Clicking on the left or right side of the selection allows you to grow or shrink it from that direction. Holding the ⌥ (Option) key and dragging the selection lets you move it left or right. Clicking once anywhere on the profile will clear the selection. Highlighting Ascent RateMacDive can optionally highlight your ascent rate. Periods of fast ascent will be displayed in Orange, and excessive ascent speeds will be displayed in red. You can toggle this option via View > Highlight Fast Ascents or by using the shortcut, ⌘ ⇧ H. Adding bookmarks to the profile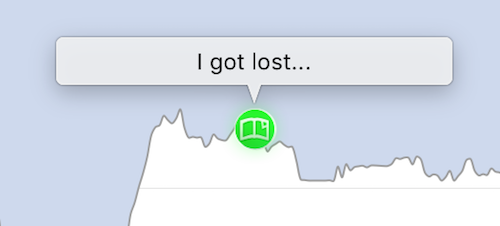
You can right-click anywhere on the profile to create a bookmark. Clicking on the bookmark shows a Tooltip, this can be freely edited to leave a note on your dive. Right-clicking on the bookmark icon again will give you the option to remove it. Deleting Alarms And BookmarksYou can also right click on any existing Alarm, Bookmark or Photo and select the Delete option, if you'd like to remove it. |